Building Department Productivity and Technology
A Statistical Analysis
Introduction
Paul Krugman, the Nobel Prize winner in economics, once wrote “Productivity is not everything, but in the long run, it is almost everything.” Productivity is important in general and its importance is not any different in a building department.
Productivity is important in a building department for multiple reasons, not only does productivity have a direct impact on budgets and financial aspects, but also on several other factors. One of those factors is customer service, by being more productive, customers are served faster and better. Another reason is staff morale, when staff is productive, they feel a sense of service, accomplishment and purpose in their employment, which leads to even more productivity. Most employees want to be productive, and the role of the building official is to remove obstacles to productivity such as reducing bureaucracy and organizational drag. With higher productivity, a building department will thrive and the overall quality and performance of work produced will improve.
This paper will first present the data that was used in the analysis, then develop a measure of productivity and use it to examine the impact of technology on productivity. This paper will also determine if economies to scale are present in building departments and present a general equation for predicting the number of permits issued given the population of a jurisdiction.
Data Description
The data was collected through a survey by CALBO Innovative Practices Committee (IPC) during summer of 2018 where members were asked a number of questions relating to staffing and technology usage. The data is for staffing and work levels during the calendar year 2017. Two surveys were sent, the first one asked questions that include:
1. Permits: Number of permits the jurisdictions issued.
2. Staff: Overall number of staff members in the building department.
3. If the jurisdiction uses online permitting, online inspections requests or electronic plan check.
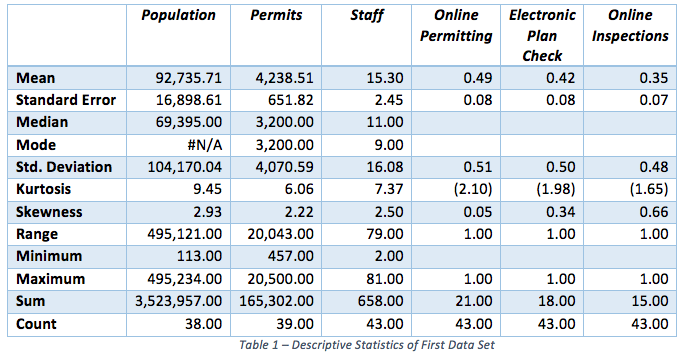
The number of jurisdictions that responded was 45. The average population of the responding jurisdiction is 92,735 and has a staff of 15.3 employees that issued 4238 permits. The responding jurisdictions employed Online Permitting, Electronic Plan Check and Online Inspections at a mean of 49%, 42% and 35% respectively. The three variables of Online Permitting, Electronic Plan Check and Online Inspections were converted to binary (aka dummy) variables, taking the value of one if a jurisdiction employees this technology and a value of zero otherwise.
The standard deviation is relatively high in the data. The standard deviation measures the degree of variation of the data. For example if you have two sets of numbers, the first set is {4,5,6} and the second set is {1,5,9}, they both have the same mean of 5, but the second set has a higher degree of variation and hence a larger standard deviation.
Table 1 presents the descriptive statistics of the data.
Additional data was needed, so a follow-up survey was sent with questions including the following:
1. Staff: The number of building department employees dedicated to permit issuance, plan review and inspections, and excluding other employees such as ones tasked with code enforcements.
2. PCStaff and InspStaff: The number of plan check and inspections staff.
3. Consult: The percentage of work performed by consultants.
4. SysYear: Year permitting system was deployed.
The number of the jurisdictions that responded to the follow-up survey was 17. Data shows that consultants perform approximately 30% for the work of a typical California jurisdiction. The median is 20% and the standard deviation is 27%. The Average year of permitting system deployment is 2005, which indicates that the average permitting system is 13 years old as of 2018.
The following are descriptive statistics of the second data set
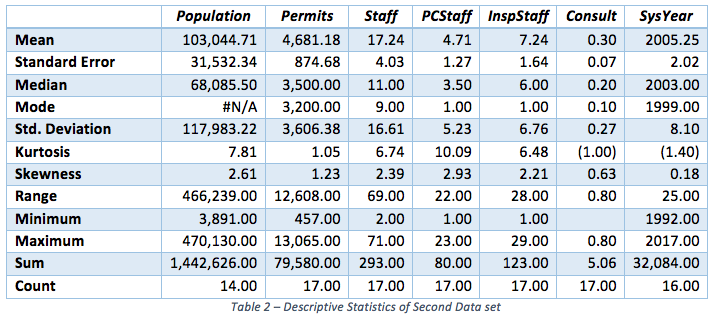
Some jurisdictions did not answer some of the questions in either the first or the second survey, which reduced the number of observations that can be used in the analysis.
Measure of Productivity
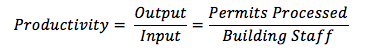
In general, productivity is measuring output for a given amount of input. The output of a building department primarily consists of permits processed through plan check, issuance and inspections. Mathematically, productivity is the ratio of output to input:
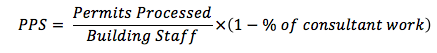
This ratio is further refined to take into account how much of the building department work is being done by consultants. This formulated measure is determined as follows:
The distribution of PPS is shown in Figure 1. The vertical axis in the graph represents the count of jurisdictions for a given PPS range on the horizontal axis. For example, the number of jurisdictions with a PPS between 150 and 200 is 4.
A higher PPS means more permits are processed per staff member, which generally indicates higher productivity. Productivity can be related to efficiency. Efficiency is optimizing the usage of inputs or utilizing the inputs in the fullest extent and best manner possible. Higher efficiency is one way to increase productivity through either producing more or using less inputs.
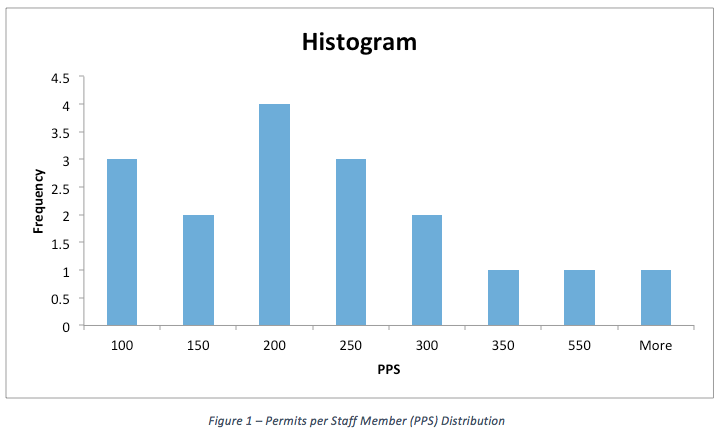
Examination of the PPS data shows that on average a jurisdiction processes 235 permits per staff member (PPS) per year and the standard deviation is 191. The median for PPS is 185. The value of the standard deviation indicates that there is a high degree of variations among jurisdictions in terms of staffing.
The permit processing operation and complexity varies by jurisdiction. The PPS does not capture nor take into account the inner workings of a department, which can be a source of the variation in the data.
Inspector to Plan Checker Staffing Ratio
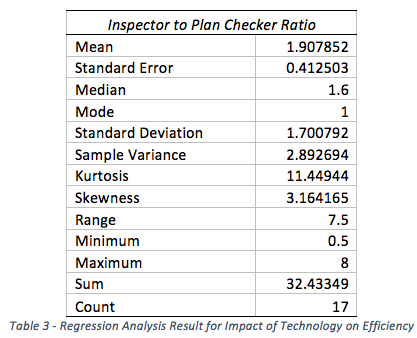
The number of inspectors typically exceeds the number of plan checkers. The amount of effort performed by an inspector is often greater and this is reflected in the fees as well, where the permit fee exceeds the plan check fee.
The data indicates that the average ratio of inspector to plan check staff is 1.9. The median is 1.6 and the standard deviation is 1.7. Table 1 shows the summary statistics for inspector to plan checker ratio.
Is There a Link between Productivity and Technology
Increasing productivity is one of the primary reasons for implementing technology in a building department. Do jurisdictions that employ technologies need less staff? To answer this question a regression was preformed where the dependent variable is the PPS and the independent binary variables of online permits, Electronic Plan Check and Online Inspection Requests. The observations where those technologies are used will have a value of one for those variables otherwise, it is a zero. The following are the results of the regression:
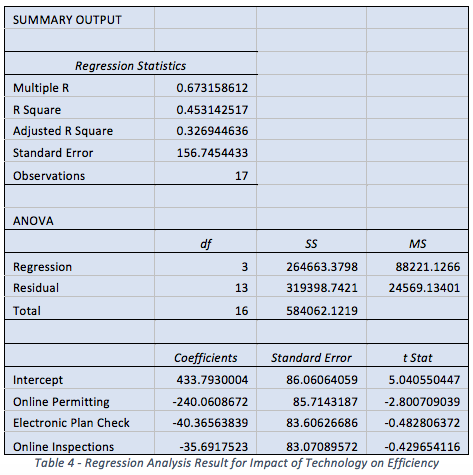
The results are contrary the assumption that technology in the building department increases productivity. The results indicate negative effect on productivity. Online permitting tends to have the highest impact and statistically significant with a t-stat of 2.8. Electronic plan check and online inspections also have a negative impact, not as much as online permitting, and those coefficients are not statistically significant.
The results are somewhat perplexing. Here are some possible explanations for the results of the analysis:
1. A possible explanation could lie in the difficulty many jurisdictions have in finding the technology that effectively match their requirements.
2. Jurisdictions may not be utilizing the technology to its fullest extent.
3. New technology might be one that needs additional staff to maintain it.
4. Staff turnover and having to learn the usage of the technology again by new staff.
5. A jurisdiction may maintain the same level of staffing upon technology implementations or now utilizing staff to improve the quality of service provided.
6. Technology in itself can be a distraction to staff, such as social media and other personal online activities.
7. Additional information and data might be needed to increase the robustness of the results.
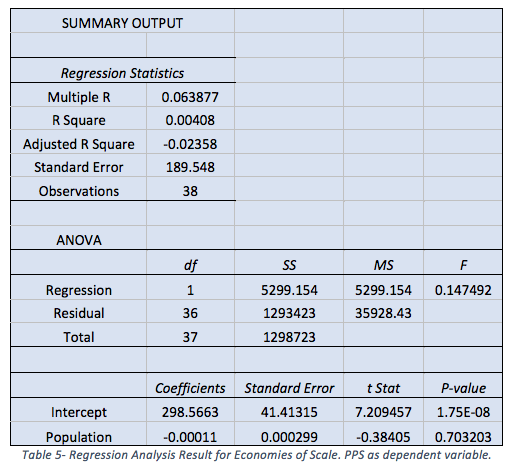
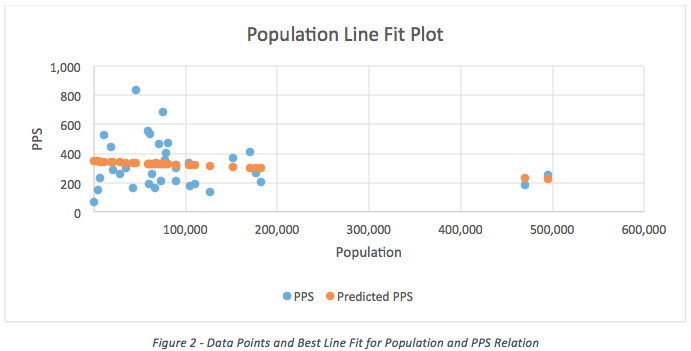
Productivity and Economies of Scale
Are larger jurisdictions more productive? Do cities with a larger population have a higher PPS? The analysis finds that economies of scale do not appear to be present. Larger jurisdictions are not necessarily more productive than smaller ones. Upon further examination of the graph and the data, the results appear to be heavily influenced by two outlier observations. Performing the regression with those two outliers eliminated had little impact on the results.
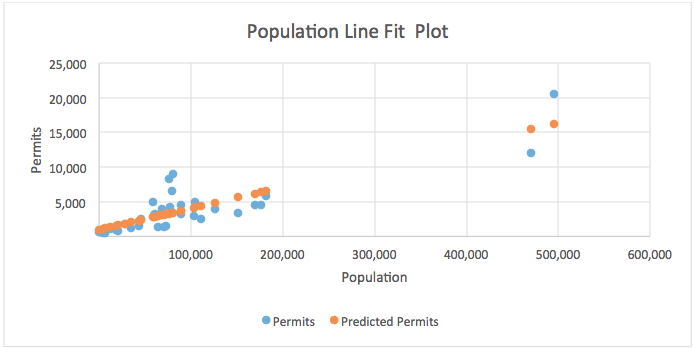
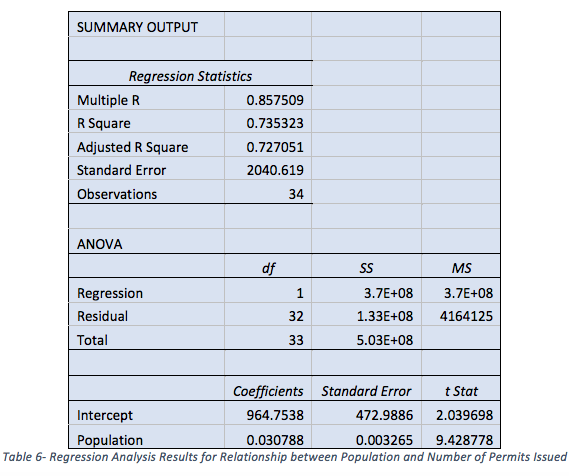
Predicting the Number of Permits Issued based on Population Size
The larger the population, the more permits are issued and this is found to be statistically significant. The general formula based on the regression is:
Number of Permits = 964 + 0.0308 x population
Conclusion
Although the data set is relatively small, many useful findings can be gained from the analysis. Those findings can be utilized in a multitude of ways to staff, check and enhance the productivity of a building department. Here are some examples:
1. If you only know the population of a jurisdiction, you can estimate the number of permits it would do, then estimate the staffing needs. For example, if you have a city with a population of 100,000, estimate the number of permits using the equation
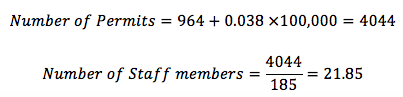
This staffing level would be the one dedicated to permits, plan review and inspections only and would exclude other tasks. This level could also be subject to other factor such as the economy.
2. If you know the number of permits the jurisdiction issues in the example above, you can more directly get an estimate of the staffing needs. For example, if a jurisdiction issues 2000 permits per year, you can estimate the staffing needs using the mean PPS of 235, and hence the total number of staff needed is
![]()
3. In example two above, if you know the percentage of work to be performed by consultants, you can re-estimate staffing using PPS. For example if a jurisdiction issues 2000 permits, and 25% of the work is performed by consultants, the building department would need the following total number of staff members:
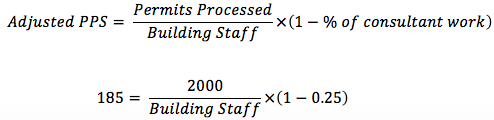
Which results to a staff of 8.33 or the number of staff members needs to be 8.33.
4. You can also determine how much work should be done by consultants given the number of permits issued by a jurisdiction and the current staffing levels. For example, if a jurisdiction issues 2000 permits and has five building department staff members, then the amount of work (and hence budget) allocation to consultants would be:
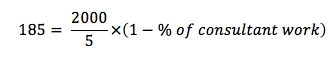
Consultant work = 53.75%
Keep in mind, the examples above only give averages and a jurisdiction must still adjust for other aspects such as complexity of operation, projects, quality and level of service. This adjustment would be judgement call on the part of the building official since the data and the analysis did not take into account those aspects. Results of the analysis has also shown that there are no economies to scale in the operations of building departments, and hence, the examples above would apply to large and small jurisdictions.
The analysis and examples above can also be used in staffing and budgeting with the economic cycle. If you anticipate an increase or reduction in number of permits forecasted for next year, you can adjust your staffing, consultant use and budget accordingly. The results of that analysis can also be useful when conducting benefit-cost analysis in choosing between increasing in-house staff or using consultants, as well as determining the benefits and costs of technology.
Technology did not seem to have a positive impact on productivity. The finding was somewhat confounding, since we expect improved productivity from technology. The survey did show significant degree of dissatisfaction by current permitting system in most jurisdictions, which may confirm the lack of contribution of technology to productivity as determined by the statistical analysis. Future analysis will rely on a larger data set which can possibly change the results of the analysis on technology and refine other measures.
CALBO Innovative Practices Committee is grateful to the many members and the jurisdictions that took the time to respond to the survey. This analysis will be updated next year; additional participation in the survey would be appreciated.
An online calculator was created using the regression equations; you can try it at http://codetools.tracksoftinc.com/default.aspx
For any questions regarding this article, please contact the CALBO Innovative Practices Committee.